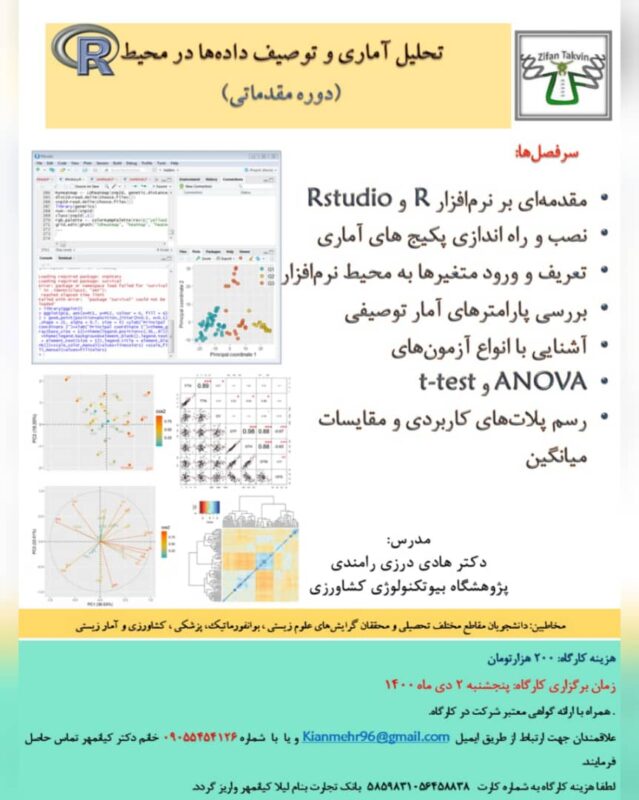
دوره مقدماتی تحلیل آماری و توصیف داده ها در محیط R

به گزارش پایگاه اطلاع رسانی بیوتکنولوژی ایران، دوره مقدماتی تحلیل آماری و توصیف داده ها در محیط R،
در تاریخ 2 دی ماه 1400
ساعت 9 تا 12 و 13 تا 15
برگزار می شود.
مدرس دوره: آقای دکتر هادی درزی رامندی، پژوهشگاه بیوتکنولوژی کشاورزی ایران
سرفصل های کارگاه:
Basics of R
R installation-Using and installing Rstudio-Working with vectors-Working with matrices-Generating data-Files in the working directory-Packages-Updating R and packages-Accessing the help files-Save a session in RData format –Functions used in this chapter
Reading and subsetting data
Reading CSV files-Reading other data-Excel spreadsheets-Tab-delimited text files-Reading typed data-Other foreign formats-Convert vectors into a dataframe-Working with dataframes-Variables in the dataframe-Changing column names in dataframes-Subsetting dataframes-Deleting columns from a dataframe-Exporting data
Visualizing data
The R graphics system-Plotting in Rstudio-Choosing a plot type-Using the plot function-Bar plots-Histograms and curves-Pie charts-Box plots-Fine-tuning the formatting of plots-A quick example-Customizing and choosing colours
Ranges of colours-Semi-transparent colours-Customizing symbols and lines-Setting symbol type by a factor level
Formatting units, equations and special symbols-Resetting the graphical parameters-Changing the font-Adding to a current plot-Changing the layout-Finding out about more options-Special plots-Scatter plot with varying symbol sizes
Bar plots of means with confidence intervals-Log-log axes-Trellis graphics-Exporting figures-Saving figures-Inserting figures in Word or Powerpoint
